My party and welcome to it!
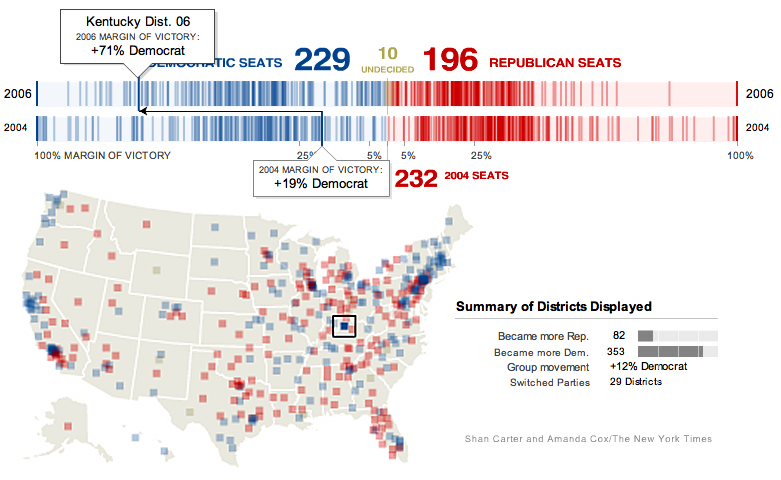
The New York Times has a wonderful interactive graphic that allows the viewer to see the quantitative shift that has taken place in any given Congressional district, by moving the cursor over the district’s geographical location, as was done below for Kentucky’s 6th District:
 (modified from the original)
Of note is that more than 81% of all directional shifts among all districts moved toward the Democratic side of the divide…
 (modified from the original)
Of note is that more than 81% of all directional shifts among all districts moved toward the Democratic side of the divide…
posted by Kathleen at 3:23 PM
![]()


2 Comments:
Boy, you move fast !!! (hehe) I left a comment under your post "bright sunny day" - go and have a cup of tea or two, come back to have another look and find you have moved on from there. As I mentioned earlier, I have mentioned your blog at #400 on my blog, 21 21 21 Great Blogs To Read.
Click on my name to see my blogs.
Thanks for stopping by, kelvin, and thanks for listing my blog - but a minor correction: I am a "her," not a "his"…
Post a Comment
<< Home